


Encyclopedia of Chart Patterns 2nd
Encyclopedia of Chart Patterns 3rd edition>>

- 330,000đ
- Brand: Thomas N. Bulkowski
- Product Code: FT
- Availability: 2
On March 24, 2000, the financial world changed. That is the beginning of a bear market that lasted 21⁄2 years. Finally, I had bear market data to use for finding chart patterns!
Here is the list of the important changes:
- Bull and bear market statistics for complete coverage.
- Expanded statistics, all in a similar format:
- Results Snapshot, at the start of each chapter shows the most important numbers and surprises.
- General statistics, including the average rise or decline, busted pattern performance, and benchmark performance.
- Failure rates, a list of ten breakpoints to show how often a pattern fails.
- Breakout and postbreakout statistics, showing performance over the yearly price range, pullback rates, and performance after a gap.
- Frequency distribution of days to the ultimate high or low, showing when the trend is likely to end.
- Size statistics, describing how performance varies for pattern height, width, and combinations of both.
- Volume statistics, including volume trend, a new concept I call volume shapes, and breakout day volume.
- For best performance, a list of trading tips and where to find them in each chapter.
Related Products
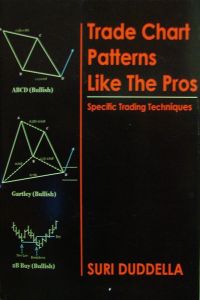
Trade Chart Patterns Like the Pros, Specific Trading Techniques. This book help you make money with it by indentify a pattern and apply the relevant techniques to Enter, manage and Exit the Trade.
Trade Chart Patterns Like the Pros Specific Trading Techniques
120,000đ

Encyclopedia of Candlestick Charts by Thomas N. Bulkowski
Encyclopedia of Candlestick Charts by Thomas N Bulkowski en
330,000đ
Visual Guide to Chart Patterns by Thomas N Bulkowski
Visual Guide to Chart Patterns by Thomas N Bulkowski en
160,000đ
Encyclopedia of Chart Patterns 3rd edition của Thomas N. Bulkowski. This edition reports on 150,000 samples, ten times the first edition (15,000) and almost four times the second edition (38,500).
Encyclopedia of Chart Patterns by Thomas N Bulkowski 3rd new edition
420,000đ