

Pivots, Patterns, and Intraday Swing Trades
Derivatives Analysis with the E-mini and Russell Futures Contracts. M. William Scheier. This book show you how to trade Stock Index Futures (S&P500, DJ30, Nasdaq100...) E-mini with Pivots, Patterns and Intraday Swing Chart.

- 120,000đ
- Product Code: PIV195628
- Availability: 2
Day trading stock index futures reveal a starkly different decision environment. There is no time to dwell on technical conditions.
Intraday volatility in the stock indices is far more exaggerated than the daily bar charts of other markets, partly due to the extreme leverage, partly due to the intense attention. And positioning techniques that prove reliable in the action of the long-term trends in other instruments tend to fail in the countertrend reactions of the highly leveraged S&P futures contract within the short-term. For the informed trader, tremendous opportunities in these intraday trend swings can be captured. This book will show you how.
Filled with detailed technical models, this reliable resource skillfully utilizes innovative methodologies for trend discovery and trade entry in mini-stock index futures markets. It offers a fresh approach to understanding and capitalizing on market volatility, allowing you to sort out the apparent chaos of the day trading environment through codified and recognizable trade entry setups.
- Highlights trading techniques that are anything but mechanical scalping
- Explores conceptual event models and their accompanying rules
- Contains tools by which major intraday swing trends can be identified quickly and often at the very turning points where they begin
- Explains the underlying order and structure to the markets based on the repetitive nature of human behavior. Engaging and informative, this reliable resource will put you in a better position to excel in today's dynamic markets.

Part One: Time Frame Concepts
Chapter 1 A Three-Frame Day
The 1st Frame
The Midday Frame
The Last Hour Time Frame
Chapter 2 Opening Range Bar
ORB Defined
3-Bar ORB 15
ORB Pennant
ORB Matched Highs/Lows
Chapter 3 Pivot/Exhaustion Grid
ORB Kilroy
Break-Away Pivots: The Pivot Ledge
The Break-Away Lap
Previous Highs and Lows
Previous Closing Prices: The Gap
Tick Bar Laps
Dynamic Exhaustion Levels: The EMAs
Floor Trader’s Pivot Points
Fibonacci Targets
Measured Move Targets
Market Profile
Trend Lines 44
Chapter 4 Dough Bar to Die Bar
Chapter 5 Leadership Divergence 55
Chapter 6 The Work-Done Concept 63
Chapter 7 Trading the News 69
Part Two… Day Model Patterns
Chapter 8 Persistent Trend Day 81
Persistence in Trend: It’s a Thing 82
ORB Entries 85
Telltale Leadership 85
Leadership Shift 87
Flubber Bounce/Monkey Bars 89
Last Chance Texaco: The 200EMA Entry 91
Summary 93
Notes 93
Chapter 9 Test-and-Reject Day 95
Summary 101
Notes 101
Chapter 10 The Split-Open Day 103
Summary 104
Notes 104
Chapter 11 Day Model Sequence Cycle 105
Summary 111
Notes 112
Part Threeâ•… Repetitive Chart Patterns
Chapter 12 The Momentum Grid 115
Summary 119
Notes 120
Chapter 13 Pre-Breakout Pause Pattern 121
Summary 124
Chapter 14 The Classics Revisited 125
M-Tops, W-Bottoms 126
Telltale Triangles 127
Head-and-Shoulders Reversals, Revised 131
The Rising/Declining Wedge 134
Midday Channel 136
Summary 139
Notes 140
Chapter 15 MA Pattern Concepts 141
The EMA Pinch 141
Gap-Close . . . or Further? 143
The EMA Cup 144
The Cup as Breakout Trigger 146
Summary 147
Part Fourâ•… Confluence and Execution
Chapter 16 Transition Time Reversals 151
Summary 156
Chapter 17 Trade Entry Models 157
Summary 172
Chapter 18 The Trade Plan 173
Prescript 174
Blueprint 176
My Blueprint Notes 179
Summary 183
Related Products

Tài liệu tổng hợp chiến lược giao dịch hợp đồng tương lai phái sinh chỉ số DJ30, S&P500, Nasdaq100. Do cùng là phái sinh chỉ số Index nên một số chiến lược có thể áp dụng trên thị trường chứng khoán VN với chỉ số phái sinh…
Index Future Trading Strategies
150,000đ
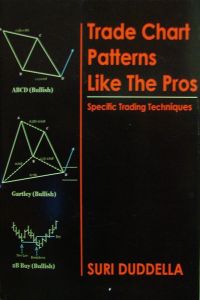
Sách tổng hợp tất các hình mẩu đồ thị (chart patterns) giúp người đọc tra cứu nhanh khi cần thiết, tốn ít thời gian hơn so với Encyclopedia of Chart Patterns, hay Bộ sách 4 cuốn của Al Brook. Sách in bản đẹp, rõ ràng tại HoaXanh. Bìa…
Trade Chart Patterns Like the Pros
120,000đ
How To Swing Trade: A Beginner’s Guide to Trading Tools, Money Management, Rules, Routines and Strategies of a Swing Trader Đặt in thành sách tại HoaXanh, xem sách in mẩu trong video bên dưới.
How To Swing Trade
105,000đ